MetaTrader Expert Advisor Free Downloads
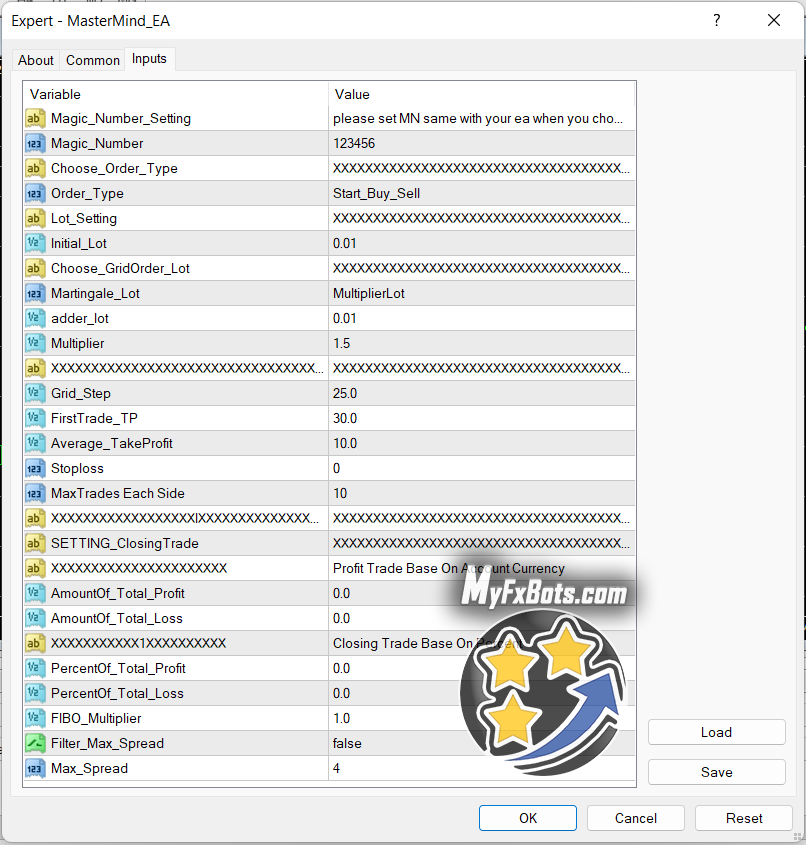
This EA only works on the mt4 platform. You can use the 1-hour time frame to run this EA. And you can use any broker, but we recommend XM as they are providing the lowest spreads than the other brokers.
We always recommend following a proper plan when you are trading forex or binary. You have to develop a proper money management plan and trading system plan. Do not get to the market and use crazy EA, you may lose your hard-earned money. You should start low lot size like 0.01.
-
Recommended Settings:
- Recommended balance minimum $500
- Initial Lot: $0.01
- Time frame: 1 minute
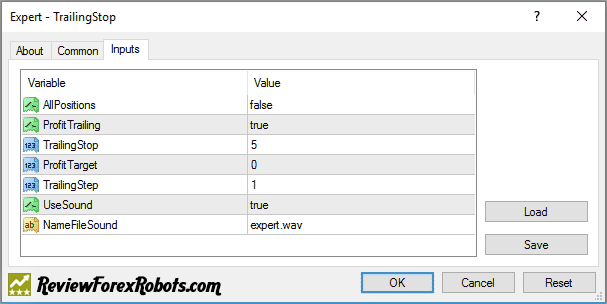
It modifies trailing stop loss on all the profitable open trades.
It also closes all the trades and can take specific profits when the trading account is in profit as a whole.
I has an instructions manual Trailing Stop Manual with parameters explanation.
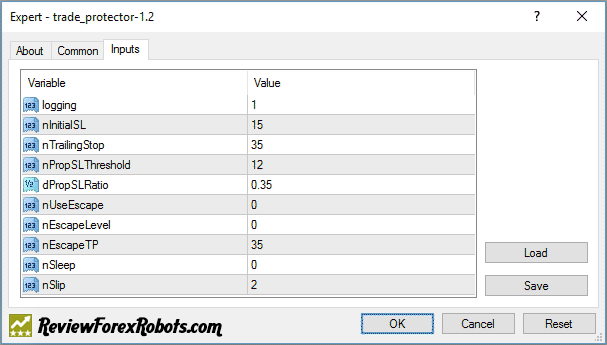
This is a bit different trailing stop Expert Advisor as it's based on the so called principle; Proportional Trailing Stop, by which it determines a % ratio of pips to be protected by a trailing stop according to the trend move direction.
When the % ration is set to "x", the EA will move the stop loss to "x %" of the difference between the current market price and the price by which the order was primarily activated / executed.
The formula for Proportional Stop Loss = | Current Price - Order Open Price | x Ratio - Spread
Parameters Explained
- logging=1; logs will be saved in the expert\files directory, =0; no logs will be saved.
- nTrailingStop=35; the initial trailing stop will be 35 pips until the trade profit reaches the nPropSLThreshold value.
- nPropSLThreshold=12; after reaching 12 pips, the profit proportional trailing stop will be activated.
- dPropSLThreshold=0.35; this is the multiplying factor and is calculated as: (PropSL = Profit * dPropSLRatio-Spread)
- nUseEscape=0.1 or 0 escape misplaced trades once they make a minimal profit.
- nEscapeLevel=0; the size of acceptable loss in pips for a trade to be terminated once it reached the next high.
- nEscapeTP=35; the take profit level in pips, if set to a negative value then it will be considered as a pre-determined trading loss to risk.
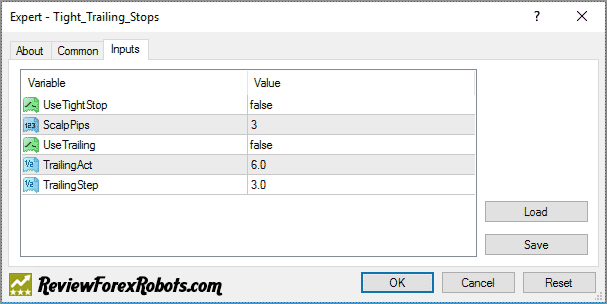
It sets a really tight stop loss order and trailing stops and it might be incompatible with some Forex brokers
Parameters
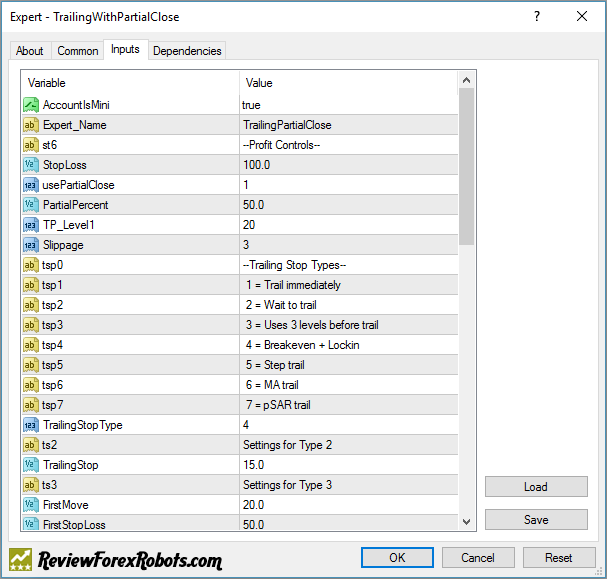
- UseTightStop=true, it enables setting up a trailing stop.
- TrailingAct is trade profit in pips after which the trailing stop will be activated, if set to 15 for example, the trailing stop will be activated when the trade is in 15 pips of profit.
- TrailingStep is the amount in pips by which the trailing stop will trail.
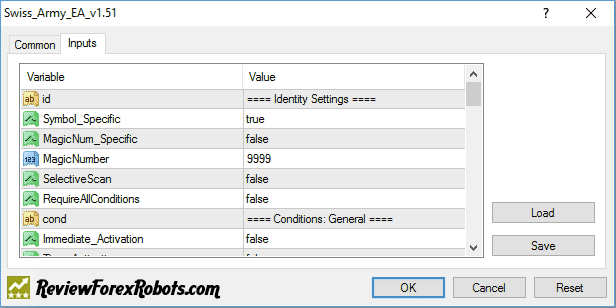
It can apply breakevens and trailing stops with setting and removing take profits and stop losses in addition to a variety of conditions for closing trades.
It prints to the screen allowed doable options, which helps to figure out what it does.
It needs some more time on a demo account to well understand how it really works.
User Guidelines
For the first time users, Download Swiss Army EA v1.51 Guidelines
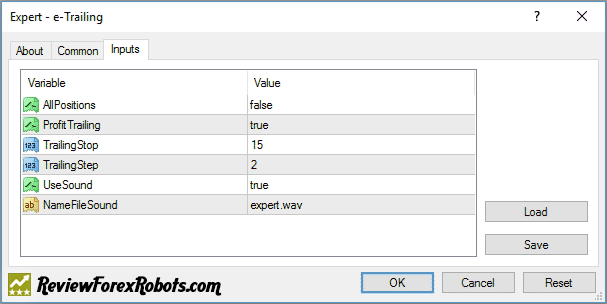
It works on one currency chart at a time, so if other charts have open trades, it needs to be attached to each of them.
It generates automatic trailing stop for all of the open trades or those that would be opened in the future.
Parameters
- AllPositions; the trailing stop is used for all of the positions.
- Profit Trailing=true; the trailing stop will be activated to a trade once it starts making profits and protect (locks in your profits), while =false; the trailing stop will be activated on opening a new position.
- TrailingStop; the trailing stop size in pips.
- TrailingStep; the trailing stop step.
- UseSound; enable or disable the use of sounds.
- NameFileSound; the sound file name.
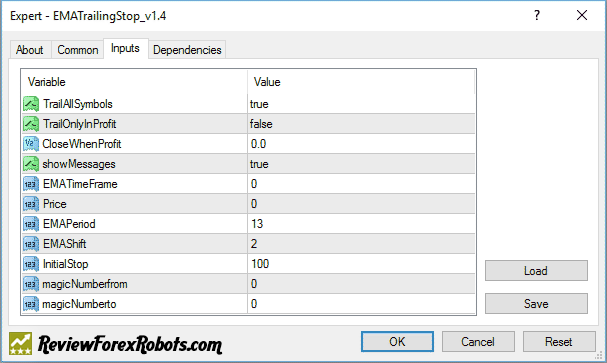
It uses a trailing stop based on exponential moving average (EMA).
Parameters
- EMA Period=13, 13 EMA will be used by the robot to trail stop the trades.
- TrailAllSymbols=true, all the currency pairs will be trailed regardless of the one it is attached to on the chart.
- CloseWhenProfit; when the sum of all profits gained from all open trades reaches this preset value, trailing starts and all the trades will be closed.
- TrailOnlyInProfit=true, a trailing stop will be activated only on profitable trades, while if =false all the trades will be trailed.
- EMAShift the EMA bar used as a trailing stop, setting it to zero (0), every EMA bar tick will be used.
- magicNumber.from and magicNumbe.to; determine the numbers that should be it trail, magic number 0 are usually for manual trades where the robot will monitor and trail manual trades along with chosen magic numbers.
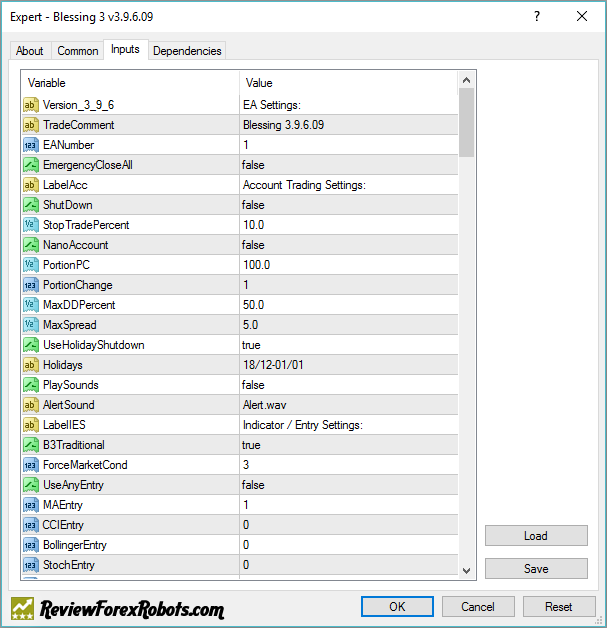
Blessing 3 EA is a Grid Expert Advisor, basically designed to determine market conditions using MA to detect the current price direction and calculate the StopLoss and TakeProfit. It can be set to make only a BUY or SELL trade instead of STOP and LIMIT trades, so BUYs are opened when the direction is long while SELLs are opened when the direction is short and in both cases profits are then harvested on trend reversal when TakeProfit level is hit.
Its an expert advisor applying Puria method Forex strategy where the MACD indicator should be attached with the following parameters: Fast EMA=15, Slow EMA=26, MACD SMA=1.
- Added to:
- Moving Average 1: MA period - 85, MA method - Linear Weighted, applied to Low, select red color.
- Moving Average 2: MA period - 75, MA method - Linear Weighted, applied to Low, select red color.
- Moving Average 3: MA period - 5, MA method - Exponential, applied to Close, select blue color.
- Trading Guidelines:
- SELL if the blue MA crossed two red MAs from above to below and the signal is confirmed by MACD indicator (one bar is closed below the Zero Level).
- BUY if the blue MA crossed two red MAs from below to above and the signal is confirmed by MACD indicator (one bar is closed below the Zero Level).
Use maximal Stop-Loss value is 14 pips.
- And the recommended currency pairs and timeframes are:
- AUDJPY - M30 - 15 points (i.e. the deal should be closed at 15 pips of Take Profit);
- NZDUSD - 1H - 25 points;
- USDCAD - H1 - 20 points;
- EURGBP - H1 - 10 points;
- USDJPY - M30 - 15 points;
- GBPUSD - М30 - 20 points;
- USDCHF - M30 - 10 points;
- EURCHF - H1 - 15 points;
- AUDUSD - M30 - 10 points;
- EURJPY - M30 - 15 points;
- CHFJPY - 1H - 15 points;
- CADJPY - M30 - 20 points;
- EURUSD - M30 - 15 points.
The main purpose of using SMA Multi Hedge Expert Advisor is to make money off the difference in the interest rates.
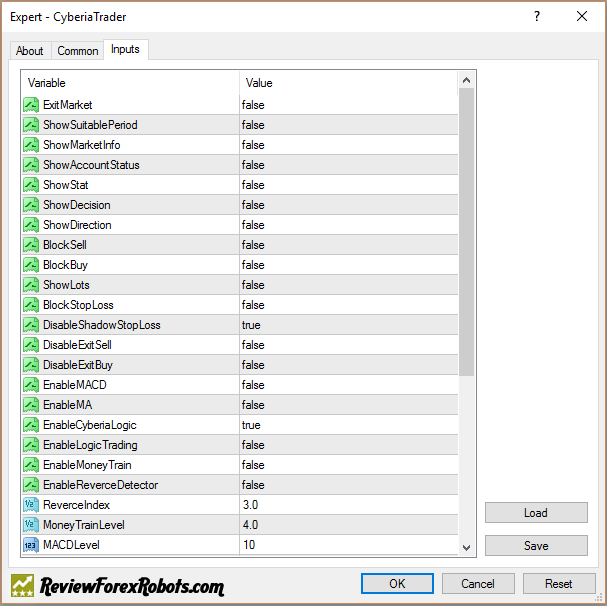
Cyberia Trader Expert Advisor is a professional EA running on currencies with 2 points spread on 1-minute intervals, it has specific trading technologies, its results could be 100% to 300% daily profits using default settings, it works with cross-currencies, automated calculation of lots for a preset exposure, etc.
This is the final application of the expert advisor system used in 2008 EA Championships, it could be a profitable expert advisor if used correctly.
MetaTrader Indicator Free Downloads
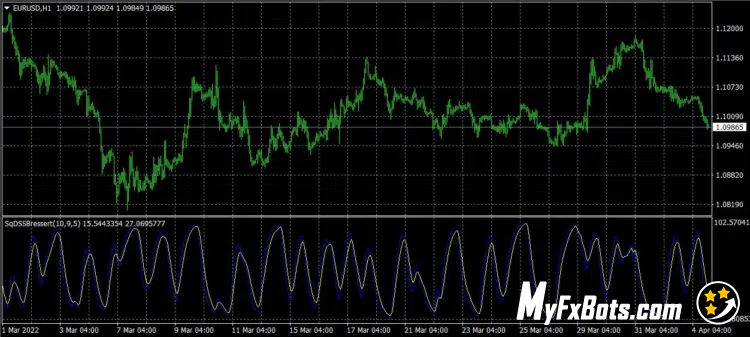
Double Smoothed Stochastics – DSS Bressert is an oscillator introduced by William Blau and Walter Bressert shortly after each other in two slightly different versions. The calculation of DSS Bressert values is similar to the stochastic indicator. The difference is the use of double exponential smoothing. The advantages over the classic stochastic oscillators are the fast response to price changes in a still very smooth pattern. In addition, the extreme zones at the other end of the scale are reached quite frequently, even in strong trends, resulting in many trends confirming signals. Double Smoothed Stochastics – DSS The Bressert values are the same as the stochastics – values above 80 indicate an overbought condition of the market, and values below 20 indicate an oversold condition of the market.
The indicator has two lines:
- DSS
- DSS Signal
We have added these conditions:
- DSS is crossing UP/Down
- DSS is rising/falling
Indicator is implemented for: MT4/MT5/Tradestation/ Multicharts
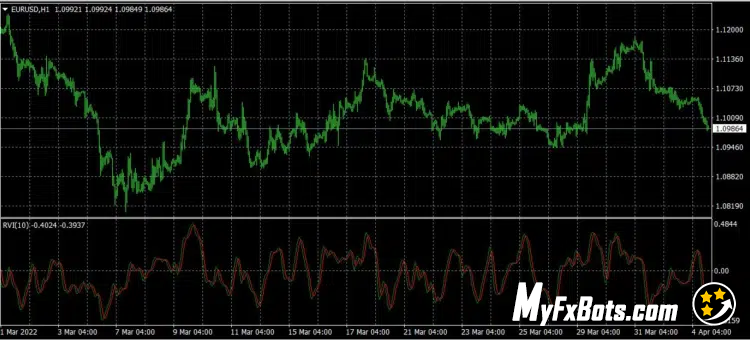
The Relative Vigor Index (RVI) is a momentum indicator used in technical analysis. It measures the strength of a trend by comparing the closing price of a security with its trading range and smoothing the results using a simple moving average (SMA).
The RVI is interpreted in the same way as many other oscillators, such as the Moving Average Convergence-Divergence (MACD) or the Relative Strength Index (RSI). While oscillators tend to fluctuate between fixed levels, they can remain at extreme levels for extended periods, so interpretation must be done in a broad context to be actionable.
The indicator has one line:
- RVI
- RVI Signal
We have added these basic conditions:
- RVI is rising/falling
- RVI is above/below level
- RVI crosses above/below level
Indicator is implemented for: MT4/MT5/Tradestation/ Multicharts
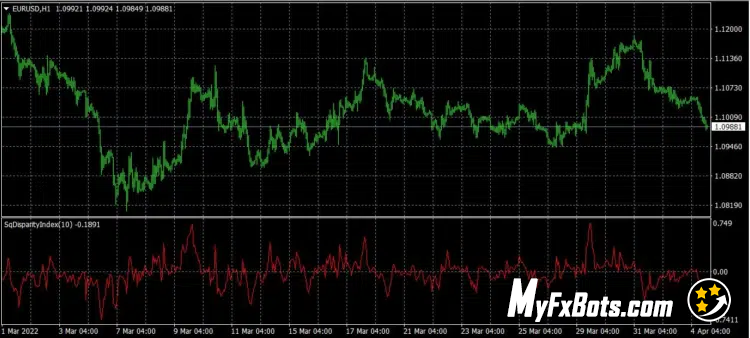
The Disparity Index (DI) is a technical momentum indicator that measures the percentage value of an asset’s current closing price relative to its moving average. Simply put, it helps compare the current market price to the moving average of the price over some time. A positive percentage indicates a rising price, while a negative percentage indicates a falling price. Traders use the DI to identify overbought/oversold market conditions of an asset, which can lead to sudden price reversals.
Whenever the disparity index crosses the zero line, the indicator generates very useful signals. A change in trend is imminent when the indicator crosses the 0 line. A price correction is inevitable when the indicator shows extreme values. The DI indicator shows extreme values because assets are falling into the overbought/oversold zone. Extreme values indicate that a trend reversal is imminent and traders should stop following the trend. Values above zero indicate an uptrend, while values below zero indicate selling pressure during the downtrend. Divergences can also be detected using the DI indicator. Whenever the indicator and the price do not move in the same direction, this indicates a divergence.
The indicator has one line:
- Disparity index
We have added these basic conditions:
- Disparity Index is rising/falling
- Disparity Index is above/below level
- Disparity Index crosses above/below level
Indicator is implemented for: MT4/MT5/Tradestation/ Multicharts
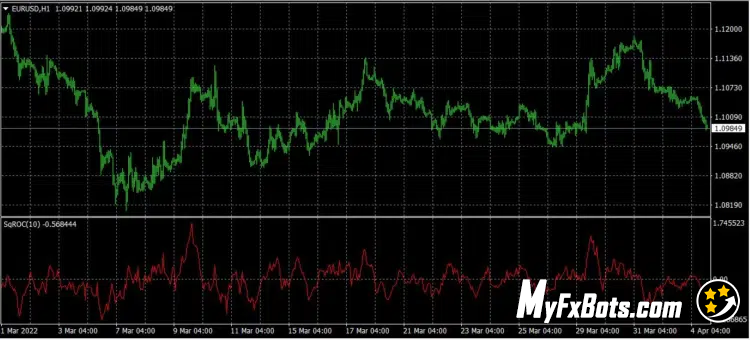
The rate-of-change indicator (ROC), also referred to simply as momentum, is a pure momentum oscillator that measures the percentage change in price from one period to the following one. When calculating ROC, the current price is compared to the price “n” periods ago. The chart forms an oscillator that fluctuates above and below the zero line as the rate of change moves from positive to negative. As a momentum oscillator, ROC shows signals such as crossing the centerline, divergences, and overbought/oversold levels. Since divergences are not reversal signals in most cases, they will not be discussed in detail in this article. Although crossing the center line causes price fluctuations, especially in the short term, these crossovers can be used to identify the overall trend. The identification of overbought or oversold extremes is natural for the Rate-of-Change Oscillator
The indicator has one line:
- ROC
We have added these basic conditions:
- ROC is rising/falling
- ROC is above/below level
- ROC crosses above/below level
Indicator is implemented for: MT4/MT5/Tradestation/ Multicharts
«Optimal Detrending» article by John F. Ehlers in Stocks & Commodities V. 18:7 (20-29) is the base core of Modified Optimum Elliptic Indicator. The whole theory is described there in details. The indicator has no input parameters.
Breakout Indicator shows the high and low level for a preset period along with a buffer setting, it calculates the number of pips in between too.
Sweet Spots Indicator puts up lines on a chart in whatever incrementing sizes you set.
Hull Moving Average Indicator is a simple but effective Hull Moving Average indicator.
Level Stop Reverse Indicator is a combination of two VT Trader trading systems. The first is the default VT LevelStop Reverse and the second was modified to allow custom ATR settings.
Signal Bars Daily Indicator shows the levels for MACD, STR, EMA for M1, M5, M15, M30, H1, H4 & D1 Time Frames. It also shows price, spread and more.
Fibonacci Pivot Points Indicator is a Fibonacci pivot calculator that graphs the values onto the chart.
Highs and Lows Indicator calculates the high and low levels for up to two periods.
MetaTrader 4 Script Free Downloads
This is simple script which opens positions according to a Fibonacci Retracement object. OpenFiboOrder script has just one input variable  number of lots. The script searches for the latest Fibonacci Retracement object. Order open level is set to 1 pip over 100 fibonacci level for buy order and 1 pip under 100 fibonacci level for sell order. SL level is fixed on 0 fibonacci level. Then the script gets the first fibonacci level over 100 and sets in this place TP, so it is possible to change TP range by modification of the Fibonacci Retracement object. OpenFiboOrder calculates proper levels taking into consideration a difference between ask and bid price (spread). Just before placing order the script checks whether SL, TP and order open levels are not too close. If any error occurs, the script displays message.
MetaTrader 4 Library Free Downloads
String Library provides a group of useful functions intended for working with strings. The library perfectly complement built-in functions of MetaTrader. After copying the files into corresponding directories you can include the library by adding following line to your files: #include <StringLib.mqh>
- Functions:
- String stringReplaceAll(string str, string toFind, string toReplace) - Returns a new string resulting from replacing all occurrences of toFind in this string with toReplace.
- String stringReplaceFirst(string str, string toFind, string toReplace) - Replaces the first substring of this string that matches toFind with toReplace.
- Void stringSplit(string& output[], string input, string token) - Splits input string into output array around given token.
- String stringTrim(string str) - Returns a copy of the string, with leading and trailing whitespace omitted.
- Bool stringStartsWith(string str, string prefix) - Tests if given string starts with the specified prefix.
- Bool stringEndsWith(string str, string suffix) - Tests if given string ends with the specified suffix.
- String stringToLowerCase(string str) - Converts all of the characters in the given string to lower case (works only with English alphabet).
- String stringToUpperCase(string str) - Converts all of the characters in the given string to upper case (works only with English alphabet).
- Bool stringEqualsIgnoreCase(string str1, string str2) - Compares one string to another string, ignoring case considerations (works only with English alphabet).
Talk about Free Expert Advisors
Information, charts or examples contained in this review article are for illustration and educational purposes only. It should not be considered as an advice or endorsement to purchase or sell any security or financial instrument. We do not and cannot give any kind of financial advice. No employee or persons associated with us are registered or authorized to give financial advice. We do not trade on anyone's behalf, and we do not recommend any broker. On certain occasions, we have a material link to the product or service mentioned in the article. This may be in the form of compensation or remuneration.
-
Social & Feed
- @myfxbots
- @myfxbots.Expert.Advisors
- @myfxbots.expert.advisors
- @myfxbots.expert.advisors
- @myfxbots_eas
- @myfxbots
- @myfxbots
- @myfxbots
- @myfxbots
- @myfxbots
Tags
Forex Combo System WallStreet Forex Robot 3.0 Domination Omega Trend Broker Arbitrage FX-Builder Forex Diamond Volatility Factor Pro GPS Forex Robot Tick Data Suite Vortex Trader PRO Forex Trend Detector Swing Trader PRO RayBOT Forex Gold Investor FXCharger Best Free Scalper Pro Gold Scalper PRO News Scope EA PRO Smart Scalper PRO FX Scalper Evening Scalper PRO Waka Waka Golden Pickaxe Perceptrader AI Happy Bitcoin Algocrat AI Traders Academy Club Quant Analyzer AlgoWizard Quant Data Manager FXAutomater InstaForex RoboForex IronFX Tickmill FXVM Alpari FX Choice TradingFX VPS Commercial Network Services VPS Forex Trader QHoster GrandCapital IC Markets FBS FX Secret Club StrategyQuant X Happy Forex LeapFX Trading Academy ForexTime Magnetic Exchange XM BlackBull Markets ForexSignals.com Libertex AMarkets HFM Broker FxPro Binance ACY Securities IV Markets Forex VPS MTeletool Forex Store Valery Trading Telegram Signal Copier Telegram Copier Forex Robot Academy Forex Robot Factory (Expert Advisor Generator) SMRT Algo EGPForex
Risk
Forex trading can involve the risk of loss beyond your initial deposit. It is not suitable for all investors and you should make sure you understand the risks involved, seeking independent advice if necessary.
Forex accounts typically offer various degrees of leverage and their elevated profit potential is counterbalanced by an equally high level of risk. You should never risk more than you are prepared to lose and you should carefully take into consideration your trading experience.
Past performance and simulated results are not necessarily indicative of future performance. All the content on this site represents the sole opinion of the author and does not constitute an express recommendation to purchase any of the products described in its pages.


