Announcing EA Analyzer version 3
First of all, I'd like to announce that EA Analyzer have released a new version 3 of the indispensable tool. This is a major release including many new features - one of the most important of them is extendability - by which you can extend your EA Analyzer to use your own What-If, Equity Control or Monte Carlo methods.
Why with equity control the results are better?
With equity control functionality you can simulate and test different methods that use equity curve to control trading logic. In other words, the strategy can estimate its own trading performance in the past (its equity curve yet), so it will better determine how it should trade in the future, so how could we do that?
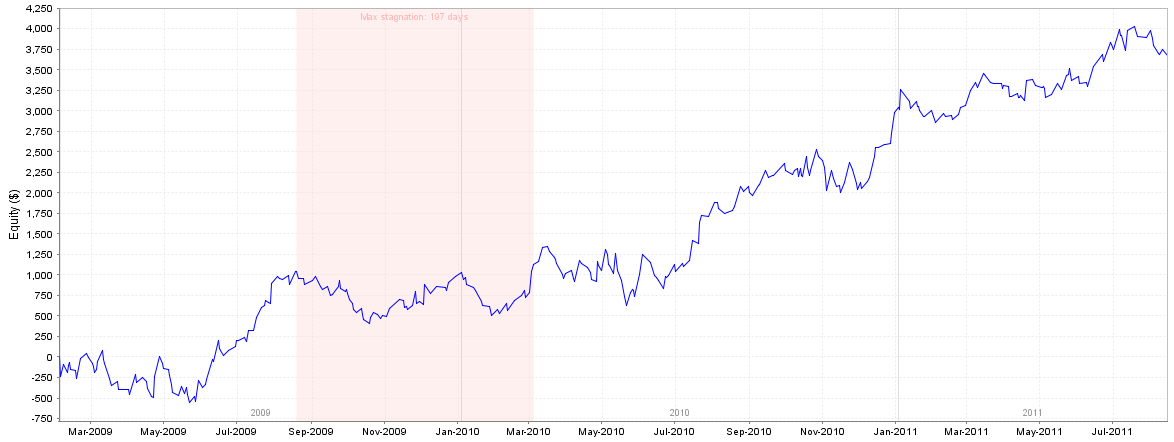
First we will need a strategy (results) to try to improve its performance. In this post we will have Test_EURUSD_strategy as a sample strategy and its equity curve is shown below.
When we tend to improve a strategy performance we primarily try to add one or more market filter, improve the strategy entries or exits, reduce losing trades and elevate winning ones count.
But the more interesting option we are discussing here is the system equity curve management, through which we examine the past strategy performance so we can use the resulting information to determine if we should perform the next trade or not.
Equity Curve management simple example using moving average
We simply add 20 period moving average to the equity curve generated by the strategy.
Then we apply these rules:
- If the moving average is below its parent current equity curve and a new trade should be open, the perform it.
- If the moving average is above its parent current equity curve, then just perform a paper trade and update strategy equity curve (don't take the trade for real).
Equity Control Simulation
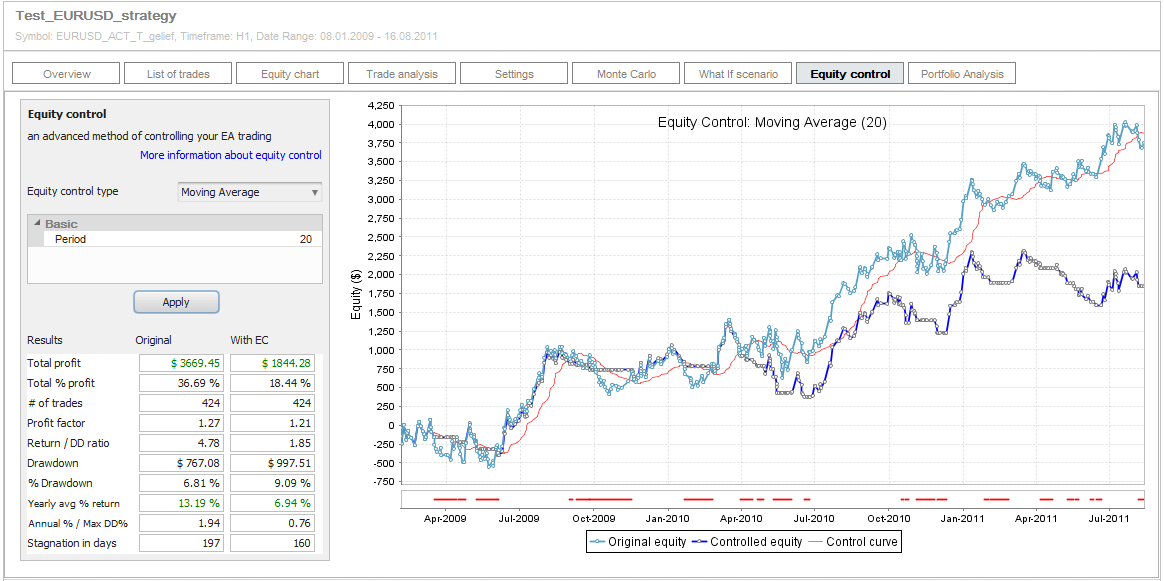
The previous example is easily simulated in EA Analyzer through its Equity Control tab. you just need to choose the desired Equity Control type, set its parameters and click on Apply. For example we will use Moving Average with period 20.
By clicking Apply, two curves are generated; the original pure equity curve and the "Controlled" equity curve with trading those rules applied. The red control line can also be seen, in this example 20 period moving average of the original equity that determines if the trade is performed or not.
Special equity control chart
It should be noted that the equity control curves are displayed in a special form where each point is a new trade and the equity level at that point is the actual account balance at the trade open. This allows trades control through the curve itself, so we can decide to perform the trade or not based on the account balance when opening the trade; just like in real trading.
Multiple trades being opened exactly at the same time are "grouped" to one trade point.
The red thick line near the lower margin of the chart clearly displays the periods where no trades were taken or changed by the equity control.
The chart above can till us clearly that applying equity control this way didn't improve the strategy results and even made them worse, here is a detailed zoom view for the first few months.
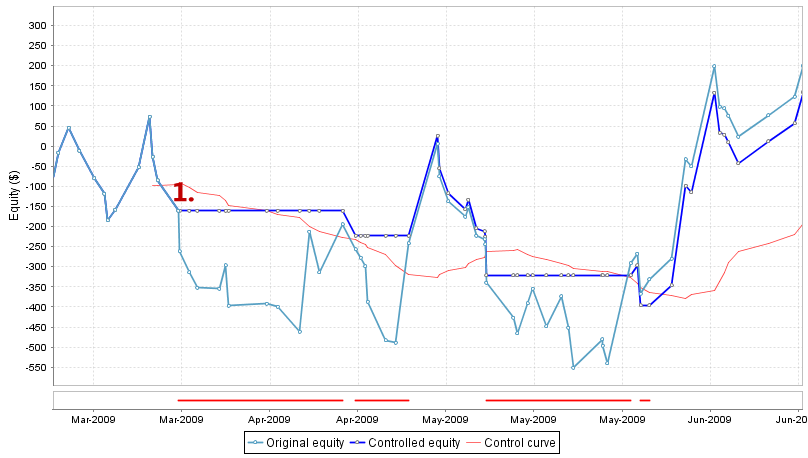
Both original and controlled equity lines are the same from the start of this chart till point 1. from where the equities differed:
- The original one showed that the strategy continued trading making more losses.
- The controlled strategy ceased to trade for the next few opportunities as the current equity was below its moving average (red line) at the trade open. So the strategy kept holding to prevent going into further losses until the original equity jumped above its moving average again.
This proves that equity control has worked beneficiary by prevented the strategy from making deeper losses by missing trades when the original equity curve was below its moving average.
Why are the final controlled strategy results are worse than those of the original one?
Another section of the chart can answer this question, starting at around March 2010.
As was in the previous zoomed chart section, both the original and controlled equity lines are the same until point 2. but on contrary, later on the "controlled" strategy kept performing losing trades compared to the original one.
This is simply caused by the trading rules applied, as they prevent the strategy from trading when its moving average is above its equity, this leads it to pass some losing trades preventing further loss, while it will also pass some winning trades that made the original strategy recover from its previous losses.
In this chart the strategy missed very profitable trades at points 3., 4. and 5. as at the time when these trades should have been opened, the moving average was above its parent original equity curve.
The next trade will not be made by the Controlled strategy unless the original equity climbs back above its moving average.
Equity Control Applying Example Conclusion
The previous example proves that if not used right, th equity control doesn't improve anything, even it almost always decreases the profit and also increase drawdown.
But we can use something else that could be effective
Instead of missing a trade when average is above equity we can double its size. The rules will be simple again:
- If the moving average is below its parent current equity curve and a new trade should be open then perform it with its original size.
- If the moving average is above its parent current equity curve and a new trade should be open then perform it with double size.
And so we aspire that a profitable trade should come after few losses and double size will get the profit drom it doubled.
EA Analyzer version 3 Extenability
The latest version of EA Analyzer v3 enables you to create your own equity control function and test your own trading ideas. We will create new custom equity control function in this example using extendability functionality of the program, it's a special one that you can download here:
MovingAverageAddContracts.java
Just download it, add it to "{EA Analyzer}/extend/code/EquityControl" folder then restart the program, a new option Moving Avg Add Contracts should then be added to the equity control types selection. The parameters could be left unmodified, the parameter "Coef" is the coefficient by which the trade size will be increased if the moving average is above the equity control. This formula is used by it:
new trade size = coefficient * original size;
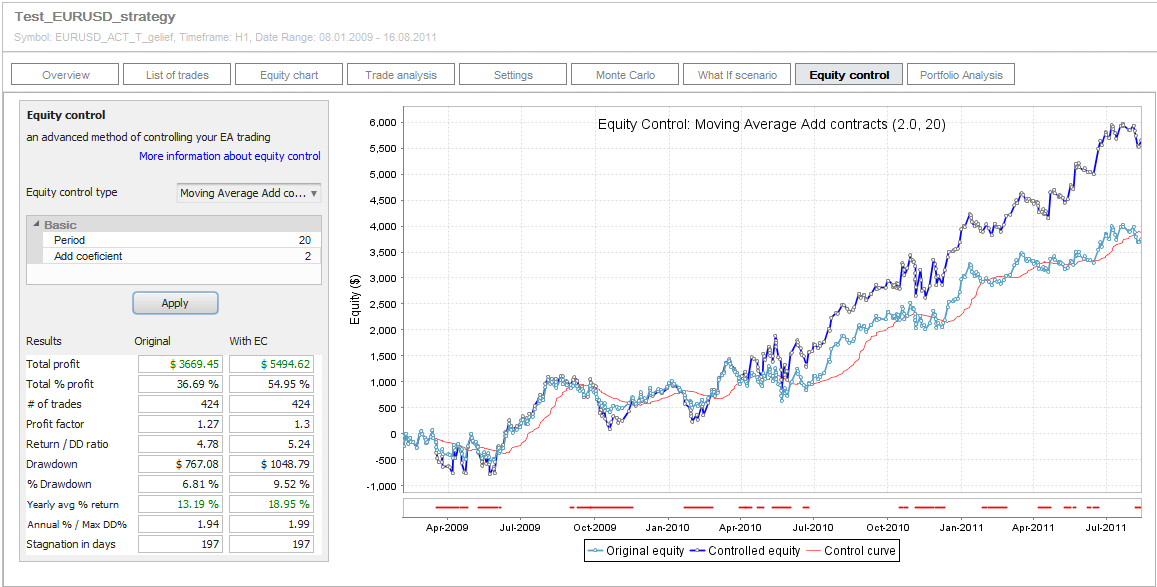
If set to 2, this will double the trade size. Click on Apply and this will be the simulation results:
This time the chart displays a significant strategy profits increase, but the drawdown was increased too a little, this indicates the possibility to significantly infuence a strategy performance by managing its future trades according to its past equity chart.
The bottom line
Only one of the many possibilities that could be applied using equity control on your strategy was discussed in the previous example, there are many others.
Other two equity control funcions are included in the program beside that you can also create your own ones to test your own trading ideas.
Equity Control disadvantages
- It's very hard to implement in EA; it's easy to simulate such control in EA Analyzer, but this is different from implementing it in your EA. In fact It seems that until now there is no EA that is able to manage trades according to its equity.
- It's based on the original strategy logic; it'll not behave similarilty on different strategies as it depends on factors like Risk-Reward ratio (size of SL vs PT), the >equity curve "look" and steepness, consecutive winning and losing trades number, and so on.
- In "chops", it may not work well; if the equity is swinging sideways, the controlled strategy might be a more losing one than the original due to its tendency to miss profiting trades when the moving average is above its parent equity.
Finally, this is an interesting considerable technique which potential results can be simulated by EA Analyzer before being implemented in a final strategy.
The newest EA Analyzer v3 includes equity control simulations capabiliy that can be run in the free version too but with some limitations.
If you like this functionality consider purchasing EA Analyzer Pro and help its developpers support EAA development.
Latest Quant Analyzer Posts


MyFxBots Admin
[Last Modified On Thurs, 24 Jul 2014]Other StrategyQuant X Forex Robots
Talk about Quant Analyzer
Information, charts or examples contained in this blog post are for illustration and educational purposes only. It should not be considered as an advice or endorsement to purchase or sell any security or financial instrument. We do not and cannot give any kind of financial advice. No employee or persons associated with us are registered or authorized to give financial advice. We do not trade on anyone's behalf, and we do not recommend any broker. On certain occasions, we have a material link to the product or service mentioned in the article. This may be in the form of compensation or remuneration.
-
Social & Feed
- @myfxbots
- @myfxbots.Expert.Advisors
- @myfxbots.expert.advisors
- @myfxbots.expert.advisors
- @myfxbots_eas
- @myfxbots
- @myfxbots
- @myfxbots
- @myfxbots
- @myfxbots
Tags
Forex Combo System WallStreet Forex Robot 3.0 Domination Omega Trend Broker Arbitrage FX-Builder Forex Diamond Volatility Factor Pro GPS Forex Robot Tick Data Suite Vortex Trader PRO Forex Trend Detector Swing Trader PRO RayBOT Forex Gold Investor FXCharger Best Free Scalper Pro Gold Scalper PRO News Scope EA PRO Smart Scalper PRO FX Scalper Evening Scalper PRO Waka Waka Golden Pickaxe Perceptrader AI Happy Bitcoin Algocrat AI Traders Academy Club AlgoWizard Quant Data Manager FXAutomater InstaForex RoboForex IronFX Tickmill FXVM Alpari FX Choice TradingFX VPS Commercial Network Services VPS Forex Trader QHoster GrandCapital IC Markets FBS FX Secret Club StrategyQuant X Happy Forex LeapFX Trading Academy ForexTime Magnetic Exchange XM BlackBull Markets ForexSignals.com Libertex AMarkets HFM Broker FxPro Binance ACY Securities IV Markets Forex VPS MTeletool Forex Store Valery Trading Telegram Signal Copier Telegram Copier Forex Robot Academy Forex Robot Factory (Expert Advisor Generator) SMRT Algo EGPForex
Risk
Forex trading can involve the risk of loss beyond your initial deposit. It is not suitable for all investors and you should make sure you understand the risks involved, seeking independent advice if necessary.
Forex accounts typically offer various degrees of leverage and their elevated profit potential is counterbalanced by an equally high level of risk. You should never risk more than you are prepared to lose and you should carefully take into consideration your trading experience.
Past performance and simulated results are not necessarily indicative of future performance. All the content on this site represents the sole opinion of the author and does not constitute an express recommendation to purchase any of the products described in its pages.


