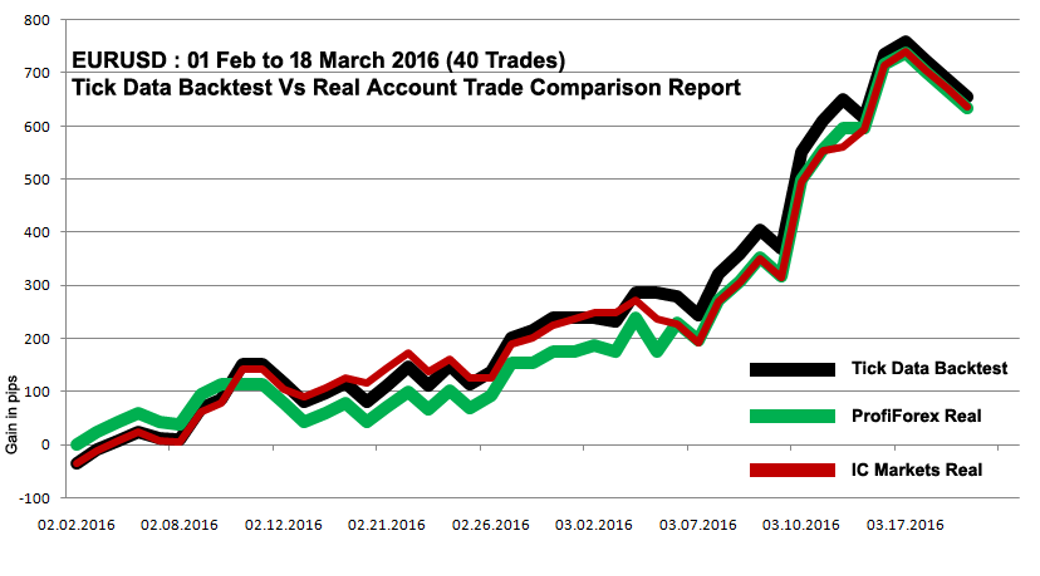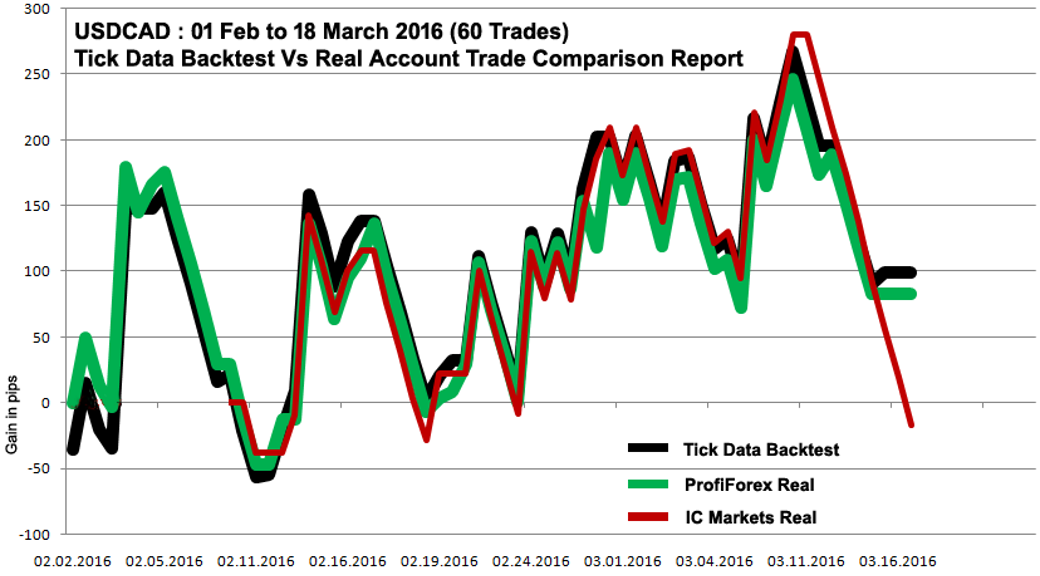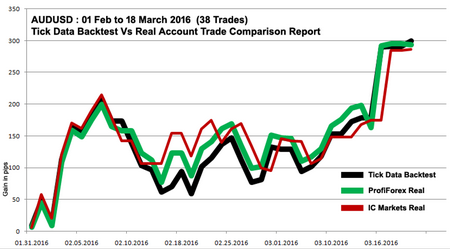
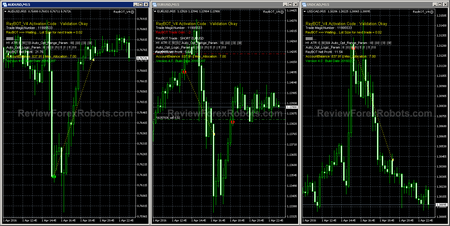
A few days ago these Tick Data backtests to Live trading results comparison charts were released by Phibase, the vendors and developers of the new amazing RayBOT EA. These results are spanning from the 1st Feb to the 18th March 2016 and here they are (to enlarge an image, left click on it):
Comparison Results For AUDUSD
Comparison Results for EURUSD
Comparison Results for USDCAD
Brief Analysis of the Comparison
- The backtests used for this comparison were performed using tickdata and the generated strategy test files were uploaded to MyfxBook for more detailed analysis at these links:
- By brief analysis for this comparison, it's obvious that the Backtest results are too closely matching those of real account live trading. This strongly validate the long-term strategy used by RayBOT algorithm. More comparison reports like this will be released periodically by Phibase every 3 months as they promised, a perfect way to properly develop and fine tune the EA strategy and performance by its own developers.
- Since the first launch of this comparison on the 1st Feb till its end, no settings updates or optimization were needed to give the previous results on the charts and they are summarized as:
- Individual currency pairs performance:
- The best performing pair was EURUSD with gains of about +630 pips.
- Comes next in performance, AUDUSD with gains of about +290 pips.
- USDCAD was the least gaining pair with a long flat period without so much contribution to RayBOT equity curve.
- Periods of loss are inevitable, but thanks to this market varieties confrontation ability of the EA strategy, the drawdown durations are maximally reduced.
- RayBOT performance has another good proof of rapid recovery capability through its positive risk:reward ratio.
- The potential profits that RayBOT can generate according to the Backtest results ranges from 5% to 15% a month using the default recommended risk of 7 with 20% drawdown which is considered logic at this risk level.
- RayBOT calculates the lot size which may vary from one pair to another in a way that guarantees a similar equity gain / loss per pip for the three pairs together. In the current market situation, the lot size calculated by the EA for USDCAD is normally larger than that calculated for EURUSD or AUDUSD.
Important Note (For Beginners)
Some users of the EA could experience unmatched trades with the 3rd party (MyfxBook) verified live performance results and this is most commonly due to missing the history files.
As stated in the RayBOT user manual, the EA uses M15 and H1 indicator calculations to generate an overview on the market's trend and price action.
Historical bars of M15 and H1 timeframes for not less than 3 days prior to the first attachment of the EA are mandatory.
To ensure that you have this in your MT4 terminal, you can do the following:
Load a chart of one of the supported pairs and change it to M15 timeframe.
From the chart properties (by left click menu on the chart), switch off the Auto-Scroll option.
Scroll the chart screen for about a week back.
Change the chart's timeframe again to H1.
Further scroll for a few days back.
Now you can attach RayBOT to this chart after changing its timeframe once again to M15.
During the previous steps, when you scroll the chart screen back, the MT4 terminal creates and stores the required HST files for drawing the chart on the screen which provides the EA with the required look back data.
Don't forget to set all the charts' timeframes to M15 before attaching the EA to them.
Latest RayBOT Posts
MyFxBots Admin
[Last Modified On Thurs, 31 Mar 2016]Other Phibase Forex Robots
Ray Scalper EA
CabEX EA
Talk about RayBOT
Information, charts or examples contained in this blog post are for illustration and educational purposes only. It should not be considered as an advice or endorsement to purchase or sell any security or financial instrument. We do not and cannot give any kind of financial advice. No employee or persons associated with us are registered or authorized to give financial advice. We do not trade on anyone's behalf, and we do not recommend any broker. On certain occasions, we have a material link to the product or service mentioned in the article. This may be in the form of compensation or remuneration.
-
Social & Feed
- @myfxbots
- @myfxbots.Expert.Advisors
- @myfxbots.expert.advisors
- @myfxbots.expert.advisors
- @myfxbots_eas
- @myfxbots
- @myfxbots
- @myfxbots
- @myfxbots
- @myfxbots
Tags
Forex Combo System WallStreet Forex Robot 3.0 Domination Omega Trend Broker Arbitrage FX-Builder Forex Diamond Volatility Factor Pro GPS Forex Robot Tick Data Suite Vortex Trader PRO Forex Trend Detector Swing Trader PRO Forex Gold Investor FXCharger Best Free Scalper Pro Gold Scalper PRO News Scope EA PRO Smart Scalper PRO FX Scalper Evening Scalper PRO Waka Waka Golden Pickaxe Perceptrader AI Happy Bitcoin Algocrat AI Traders Academy Club Quant Analyzer AlgoWizard Quant Data Manager FXAutomater InstaForex RoboForex IronFX Tickmill FXVM Alpari FX Choice TradingFX VPS Commercial Network Services VPS Forex Trader QHoster GrandCapital IC Markets FBS FX Secret Club StrategyQuant X Happy Forex LeapFX Trading Academy ForexTime Magnetic Exchange XM BlackBull Markets ForexSignals.com Libertex AMarkets HFM Broker FxPro Binance ACY Securities IV Markets Forex VPS MTeletool Forex Store Valery Trading Telegram Signal Copier Telegram Copier Forex Robot Academy Forex Robot Factory (Expert Advisor Generator) SMRT Algo EGPForex
Risk
Forex trading can involve the risk of loss beyond your initial deposit. It is not suitable for all investors and you should make sure you understand the risks involved, seeking independent advice if necessary.
Forex accounts typically offer various degrees of leverage and their elevated profit potential is counterbalanced by an equally high level of risk. You should never risk more than you are prepared to lose and you should carefully take into consideration your trading experience.
Past performance and simulated results are not necessarily indicative of future performance. All the content on this site represents the sole opinion of the author and does not constitute an express recommendation to purchase any of the products described in its pages.


